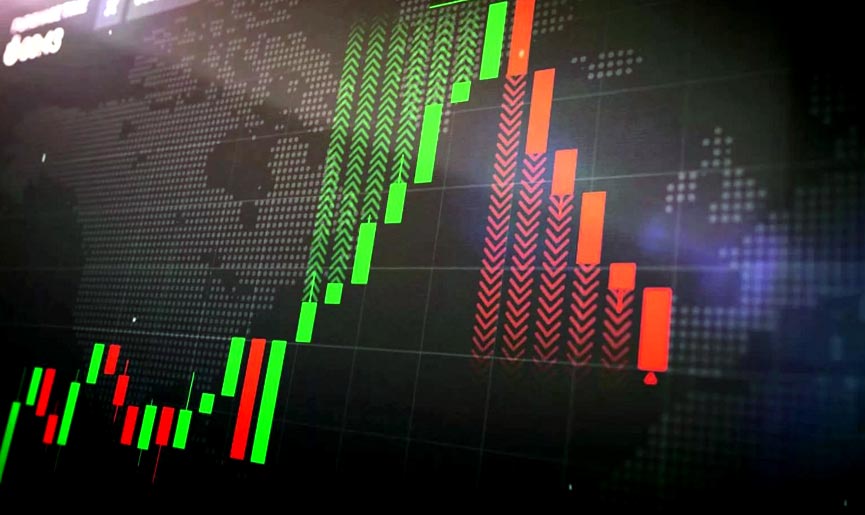
Intraday or day trading offers traders an opportunity to earn returns quickly in a single trading day by capitalizing on short-term market changes. Day trading, however, also involves many risks ranging from financial losses to rapid price changes.
Technical analysis gives investors the means and methods to assess price trends and patterns. Discover how technical analysis helps investors and traders in day trading, along with the demat account charges.
Understanding Technical Analysis
Technical analysis is a method of evaluating securities by analyzing statistical trends from trading activities, such as price movement and volume. Unlike fundamental analysis, which focuses on a company’s financial health, technical analysis relies entirely on price charts, patterns, and indicators to forecast future price movements.
Day traders use this approach to identify potential trading opportunities in short timeframes, from a few minutes to several hours. Key components of technical analysis include:
- Price Charts: These give visual representations of historical price data over different time periods.
- Chart Patterns: These are recognizable formations on charts that help predict future price movements.
- Technical Indicators: These are mathematical calculations, such as moving averages and relative strength index (RSI), that help analyze trends.
Spotting Trends with Technical Analysis
One of the main reasons traders rely on technical analysis is to identify market trends. A trend represents the general direction in which the price of a stock or other asset is moving. Understanding whether the market is in an uptrend, downtrend, or sideways movement is crucial for making profitable trades. Technical analysis helps traders:
- Identify Trends early: Chart patterns like head and shoulders or double bottoms can signal potential trend reversals.
- Confirm Trends: Technical indicators like moving averages (MA) or moving average convergence divergence (MACD) confirm whether a trend is strengthening or weakening.
- Ride the Trend: Traders can open positions in the direction of the trend and maximize their gains as long as the trend persists.
By recognizing trends, day traders can position themselves for successful trades, entering at favorable points and exiting when the trend shows signs of reversal. Remember that a demat account is mandatory to participate in day trading. There are, however, many demat account charges involved in it that you must be aware of.
Risk Management with Technical Indicators
Technical analysis equips traders with tools that allow them to mitigate risk through proper trade management.
- Stop-Loss and Take-Profit Orders: By using support and resistance levels, traders can set stop-loss orders to exit trades if the price moves against them. This minimizes losses. Similarly, they can place take-profit orders at resistance levels to lock in profits when the price reaches a predefined target.
- Volatility Indicators: Tools like Bollinger Bands or the Average True Range (ATR) help measure market volatility, allowing traders to adjust their risk accordingly. When the market is highly volatile, traders can widen their stop-loss orders to avoid premature exits.
- Position Sizing: Technical analysis helps traders calculate their position size based on risk tolerance. Using tools like Fibonacci retracement, traders can estimate potential price pullbacks and adjust their position sizes to minimize risk and maximize profit potential.
Impact of Demat Account Charges and Ethanol Stocks India on Day Trading
For day traders, it is essential to comprehend demat account charges because they have an effect on total return. It is imperative to consider these expenses while trading in securities like ethanol stocks India, among others, in order to precisely determine net gains.
Technical analysis can be used to find trading opportunities in ethanol stocks India, but traders also need to think about the costs associated with demat account charges. Investors can enhance their day trading techniques and make better selections in stocks with a thorough technical analysis.
Conclusion
Technical analysis helps traders navigate the fast-paced and often unpredictable world of day trading. By analyzing price patterns, chart trends, and technical indicators, traders can spot trends. It also allows you to time your entries and exits while managing risk effectively.
Moving Averages, MACD (Moving Average Convergence Divergence), and RSI (Relative Strength Index) are all the technical indicators you can use to ensure returns.


